and Limitations
Fire perimeters (maps) and ignition locations (tables) have been recorded and kept by the Yukon Fire Centre since 1946. The fire perimeter sketch maps (and, more recently, Landsat images) were digitized by staff at the Yukon Fire Centre and the Northern Forestry Centre.
Not all of the fires are represented as polygons. The first edition of the fires data set, completed in 1997, had only fires bigger than 200 hectares. Smaller fires are now being included, especially those occurring near communities.
In most instances, only fire perimeters have been mapped. This means that unburned areas within the perimeter are not accounted for, either in an ecological sense or in annual area burned summaries. For more recent fires mapped with the aid of satellite imagery, large unburned patches are included in the maps.
Most of the early fire polygons were taken from hand-drawn sketch maps that were included in original fire reports. The accuracy of the boundaries, and indeed the locations of these fires, have not been verified in all cases.
Although the fire maps go back to 1946, Yukon-wide fire detection capability was not fully developed until the 1960s. In addition, access to regular aerial mapping was not readily available until about the same time. As a result, many fires in the 1940s and 1950s were simply not recorded or were poorly mapped, particularly in the north. For that reason, care must be taken when drawing conclusions from the data, especially data from the early years.
Other Data Sources
Newspaper articles and photos were used with the permission of the Whitehorse Daily Star, the Yukon News, and Indian and Northern Affairs Canada, Yukon Region (Intercom). Their collaboration, and the work of their reporters and photographers, is gratefully acknowledged.
Land features data were obtained from two sources:
- National Topographic System maps, compiled by Natural Resources Canadaís Centre for Topographic Information. Reproduced under licence from Her Majesty the Queen in Right of Canada.
- Digital Chart of the World (1993), compiled by the United States Defense Mapping Agency and Environmental Systems Research Institute (ESRI).
Elevation data was obtained from the Yukon Territorial Governmentís Department of Environment. They were derived from higher-resolution digital elevation models based on 1:50 000 scale National Topographic System data files obtained from Natural Resources Canadaís Centre for Topographic Information. These elevation data were used both for the shaded relief images and the virtual fly-through movies.
Virtual fly-throughs were built using FLY and PCI, developed by PCI Geomatics. Land cover data for the fly-throughs was from Landsat Thematic Mapper imagery. The Landsat program is managed by the United States National Aeronautics and Space Administration and the United States Geological Survey.
Production of fire maps and processing of data for the atlas was done with ArcView version 3.2, developed by ESRI.
Changes in Fire Detection and Mapping Capabilities
The detection and mapping of fires has improved over the years as new technology was acquired and infrastructure built. A series of fire detection lookouts was gradually installed, mostly near communities, which helped locate many more fires. Aerial detection flights are now scheduled when the fire danger reaches threshold levels or lightning storms move through an area. There are also many more people living and traveling in the Yukon than before. With more highway travelers and more aircraft passing overhead, the chances of a fire being spotted are greatly enhanced.
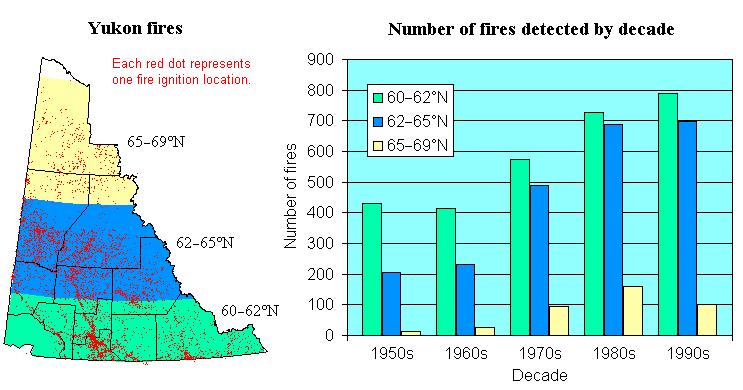
Where the improved detection and mapping of fires is most evident is in the northern latitudes of the territory. A comparison of the numbers of fires detected (see chart below) shows a fourfold increase for the central latitudes of the territory from the 1950s to the 1990s. The fire regime in this portion of the Yukon is dominated by lightning-caused fires, which typically occur in more remote locations than human-caused fires.

The numbers of fires detected for the extreme northern latitudes increased on the order of tenfold over the same time period, although the numbers are much smaller than in areas further south. This reflects both the longer fire cycle and the low human population density in the area.